Learner reporting simplified: try the latest Go1 reporting tools

When it comes to the top features that users want in their Learning Management System, there is one thing that is at the top of the list every single time. That’s right, we are talking about reporting, because what good is having an awesome learning platform if you can’t track how your learners are progressing, or how they interact with your learning content.
With the introduction of Go1 2017 we wanted to make it quick and easy for users to be able to display information about their learners and content, in the format that works best for them. As a result, the advanced reporting capabilities for Administrators in Go1 have been simplified, and anyone can create a custom report in a matter of seconds.
Here’s a quick guide on how to use our new reporting tools
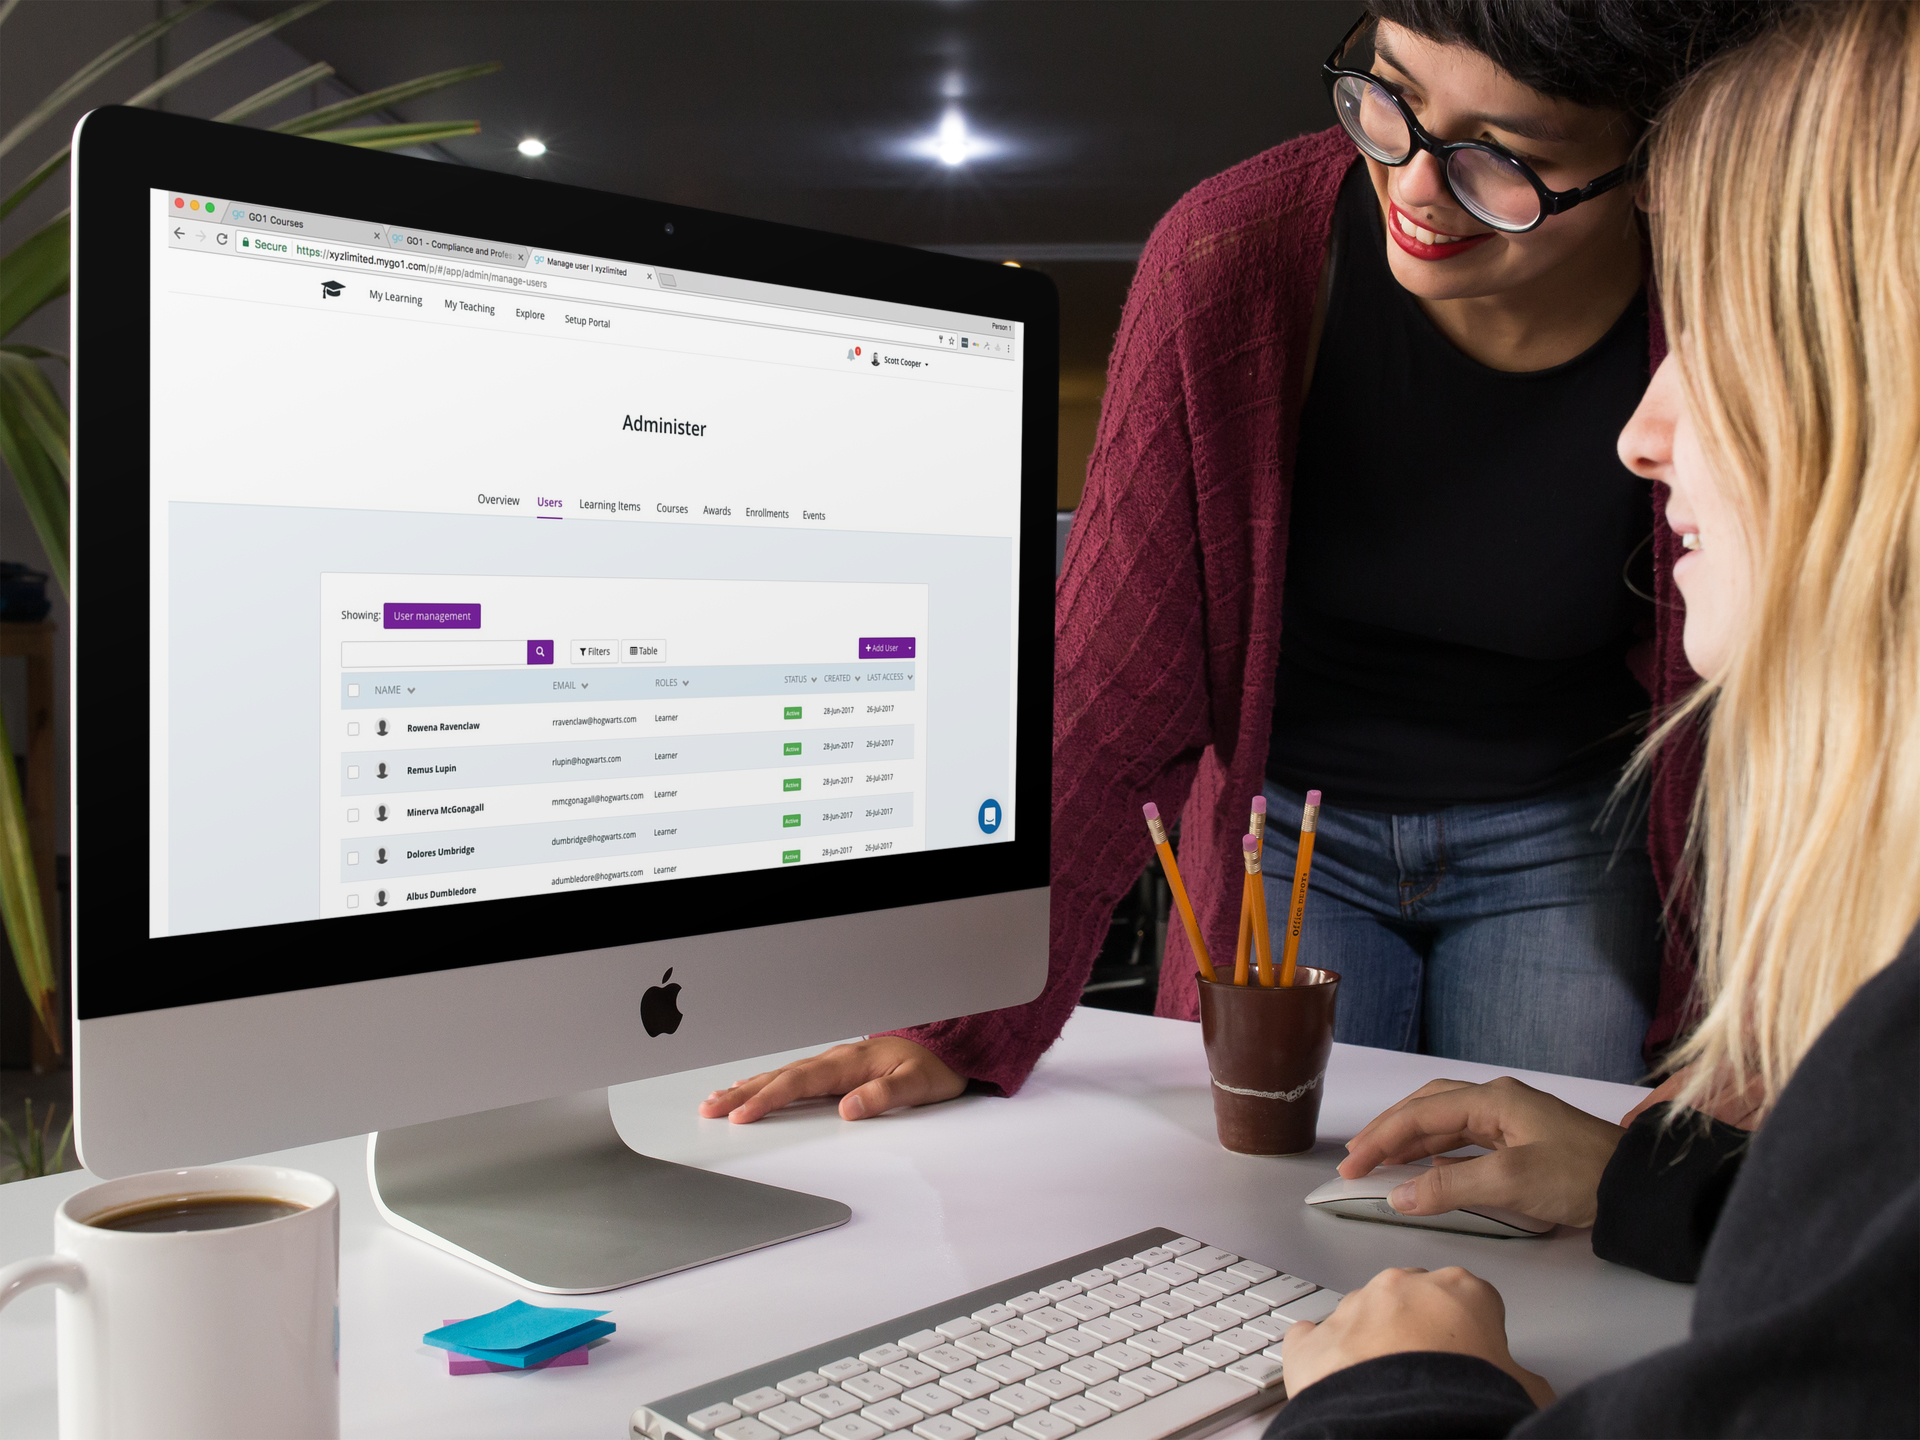
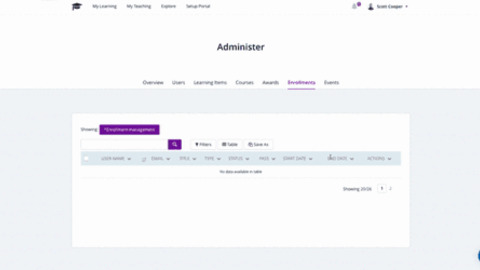
Within the Administrator section of your portal, you can jump between different types of information using the tabs at the top of the reporting field. The main area of interest when it comes to reporting lies within Users, Courses, and Enrollments tabs.
Under each tab there are a unique set of options that you can adjust to generate reports showing the data in your portal based on the information held within that tab. This data can also be displayed in a range of formats including a table, histogram, bar chart, pie chart and more.
We’ll now take a deeper look at some of the more common reports you may use:
Display users who have completed or passed courses
One of the most common reports run is to view students who have, or have not complete their assigned courses. In this example we will show you how to display all of your students that have completed courses.
Head across to the Enrollments tab in your Administrator dashboard. Click the Filters button, and then click on the Status option, followed by Completed. This will now display all of the students that have completed courses.
Another option to try out here is to search by users that have passed a course. This can be done by selecting Pass, and then Passed in the filter settings. You can also run this for Not Passed if you want to see who is yet to complete their assigned courses.
To refine this even further you can also add an additional filter to this process to display results by course too.
If you’ve like to try out a more visual representation of how many of your users have passed their assigned courses, you can also display the information as a pie chart.
Simply click on the Table button next to the Filter button, and select Pie Chart, here you can choose the information to display, and we want to show Pass, then click Apply.
Displaying users by role
This report allows the Administrator to filter out their users by their role. This could highlight all learners, Administrators, Managers, or in this case we are wanting to see which of our users are course Assessors in the system.
Start by clicking the Users tab, then selecting the Filters button, from here we can select the types of filters to apply, in this case, Role, and then we select the type of role to display.
Our final example will allow you to see how many users you have currently enrolled in each course that you have in the system.
While still on the Enrollments tab, once again click the Table button next to the Filters button. This time we will display course enrollments using the Histogram option. After selecting Histogram, we can then choose how we would like to display the information on the chart. We will select an interval of Year to show our all time results in this example, but this can be broken down to show enrollments over a set time period.
Secondly, we want to select how to group the results and in this case we want to use the Title option to display by course title. We can now see the number of enrollments per course in the last year.
As you can see in the examples above, creating your own custom reports is a very simple process and there is a very wide range of options available to ensure that you can view the data that is important to you.
These are just a few examples of how to create reports, but if you are trying to create something and get stuck, our Customer Success Team is always on hand via the live chat in the bottom right corner of your screen to walk you through the process.


